Getting Started
Reading the dashboard
Your fleet's install surface and risk posture at a glance — KPIs, trends, and what needs attention.
The dashboard is your starting point each day: a single view of how much software your fleet has installed and how risky it is.
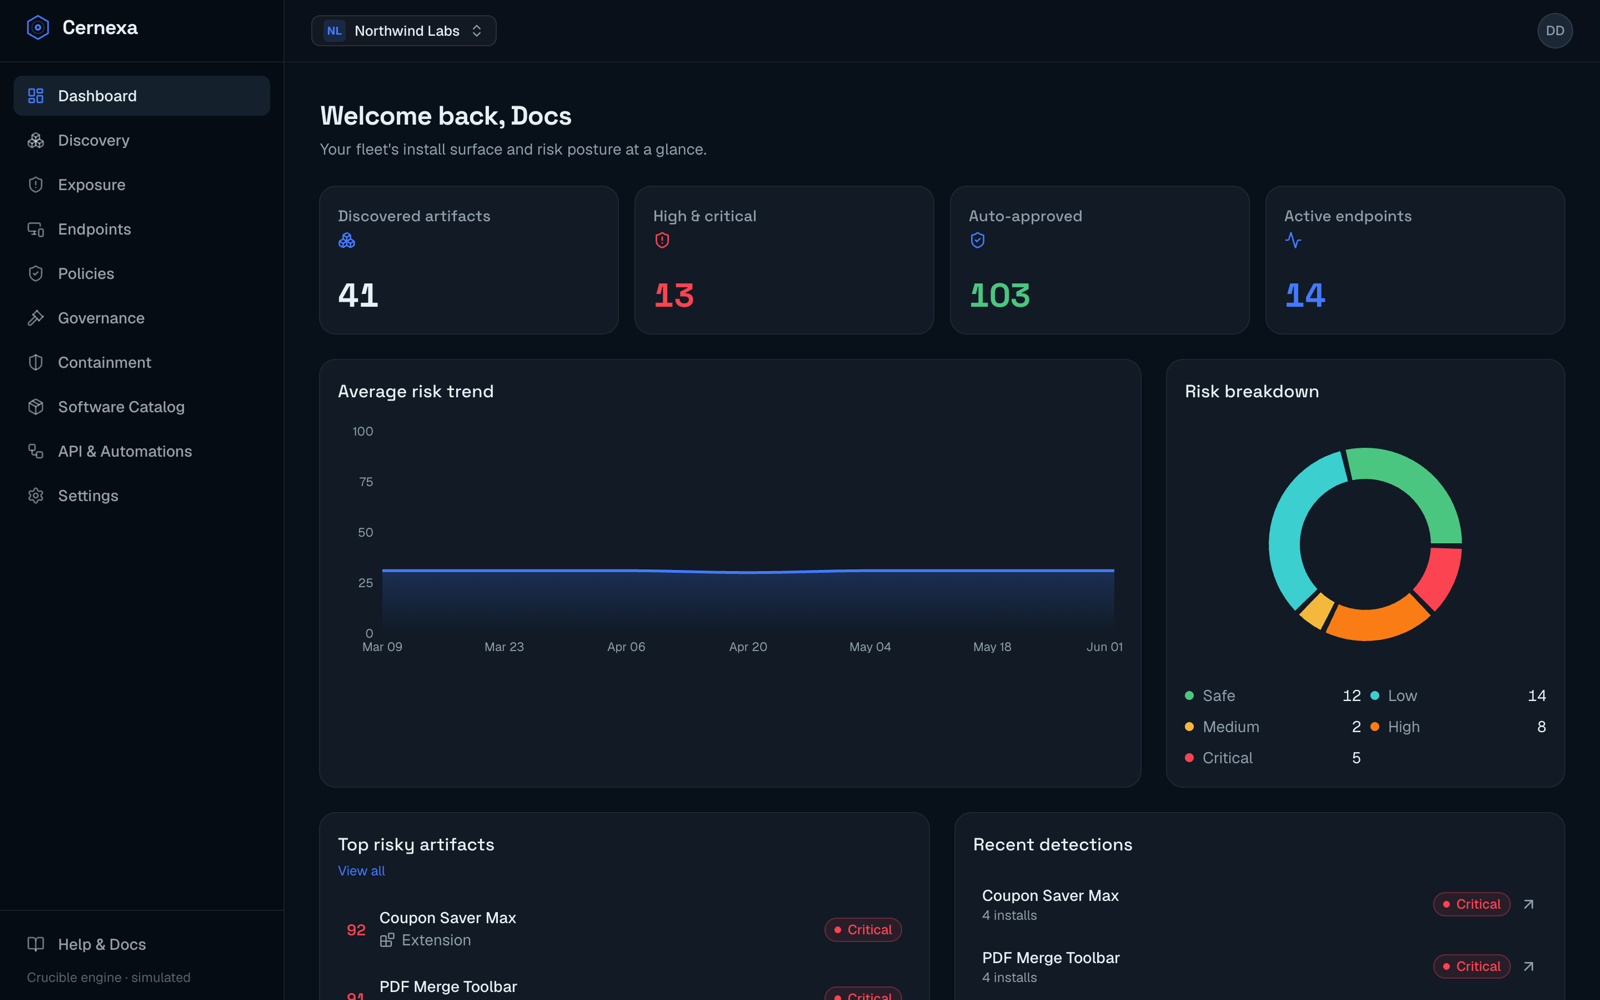
The KPIs
Four headline numbers sit at the top:
- Discovered artifacts — the total count of distinct software found across your fleet.
- High & critical — how many carry a high or critical Crucible verdict. This is your "act on this" number.
- Auto-approved — how many installs your policies cleared automatically.
- Active endpoints — how many devices have the agent reporting.
The charts
- Average risk trend — your fleet's mean Crucible score over time. A rising line means new or newly-vulnerable software is landing; a falling line means remediation and policy are working.
- Risk breakdown — a donut of how your artifacts distribute across Safe, Low, Medium, High, and Critical verdicts.
What needs attention
- Top risky artifacts — the highest-scoring software installed right now. Each row links to the artifact's detail page, where you can read the full Crucible report and take action.
- Recent detections — newly-found risky software, with install counts so you can gauge blast radius.
- Supply-chain drift — when present, this surfaces provenance changes flagged high or critical (a publisher ownership change, a permission escalation, expanded network egress, or lost verification). These link to Containment.
Where to go next
- Dig into the full inventory in Discovery.
- Check known vulnerabilities in Exposure.
- Turn findings into prevention with Policies and Governance.